Custom Column Categorizations are used to add logical groupings of data based on either the data, query results or user selections. By creating a logical categorization of data in hierarchy column (metric or non-metric), the engine effectively adds a new virtual column to the data model that represents a new way to slice, dice and view query results. These columns generally use mathematical or machine learning algorithms to generate the classifications based on the context of the current query (when they are invoked in Discover) - so they are often "contextually driven". Different column data types dictate which categorization options are available and "Geo Boundaries" categorization is triggered by user interactions in bubble maps only.
Note: Custom Columns allow the user to add granular logic to an existing model. This functionality is not available on MS OLAP, Tabular and SAP BW cubes and models since this is not possible on a predefined model framework
Custom Column Categorization Types
Context Sensitive
Context sensitive categorizations use the existing query values to determine the categories. Once generated, these then remain fixed regardless of subsequent changes to the query.
Outlier
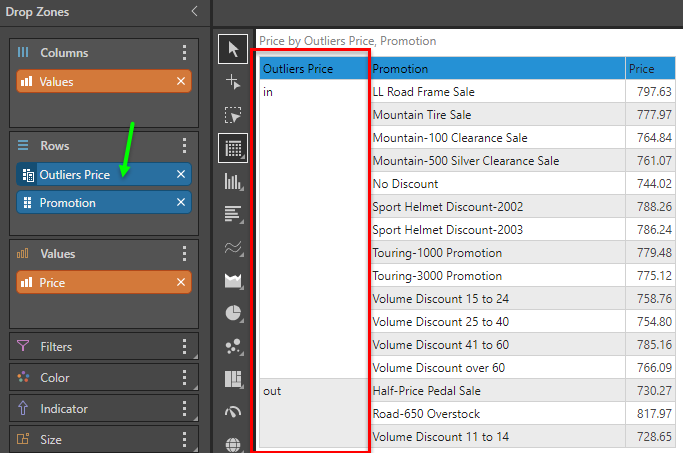
Outliers mathematically resolves which data points in the chosen measure of the query are statistical outliers and flags all points as "in" and "out". The logic uses simple standard deviation to determine the "ins" and "outs" and creates a new custom column that can be re-used in different parts of the query.
The outlier logic is only available on values or measures. It cannot be applied to hierarchies. As described, the calculation is based on the existing data points in the current query. Once determined, the outlier flags remain static regardless of any subsequent changes to the query.
- The more advanced outlier options can be found in advanced query tools in the query ribbon, which also includes a more in-depth explanation of the outlier logic used.
- Outlier logic is also available in Model for the greatest access to depth and function.
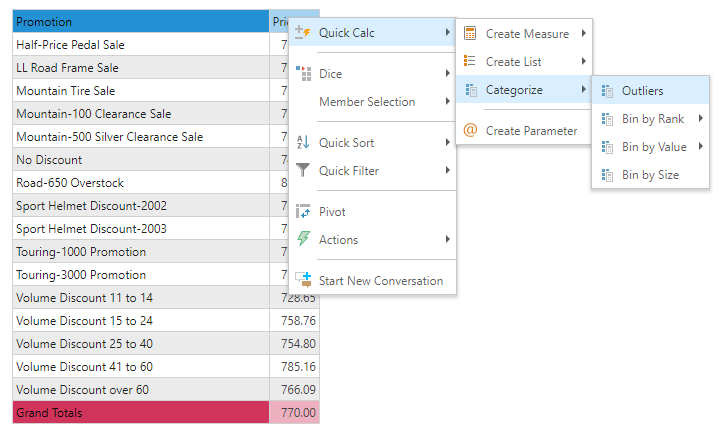
Right-click on the measure in either the drop zones or the visuals and choose "Quick Calcs".
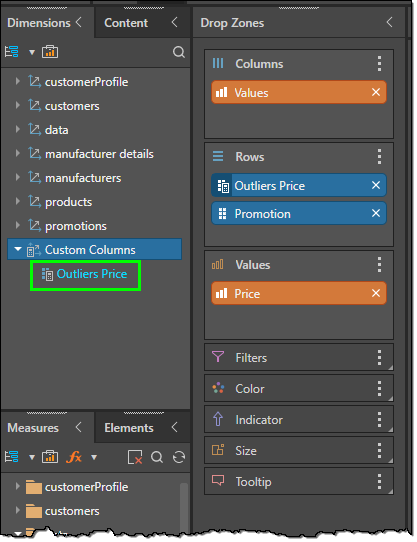
The new custom column will be auto-added to the query.
You can also find the column in the hierarchy tree
Bin by Rank
Bin by Rank takes the data points for a metric in a query and bands them evenly into each band based on its RANK POSITION in the list. This function is often called "percentile ranking", where each item is placed into a band based on its value order. The user specifies the number of bins or bands from the menu and the engine simply orders the numeric list and "chops" it up accordingly. By definition, each band will generally have the same number of elements, since the allocation to each band is based on order.
The new custom column that can be re-used in different parts of the query. This binning logic is only available on values or measures. It cannot be applied to hierarchies. As described, the calculation is based on the existing data points in the current query. Once determined, the bin definitions remain static regardless of any subsequent changes to the query.
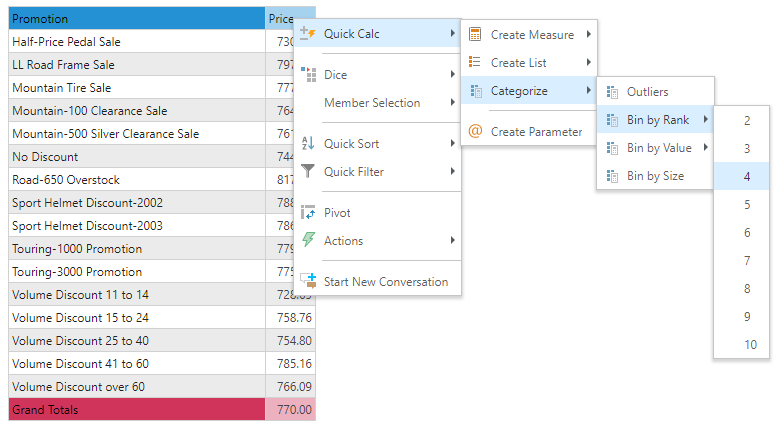
Right-click on the measure in either the drop zones or the visuals and choose "Quick Calcs". From the menu, choose the number of bins to create.
The new custom column will be auto-added to the query. You can also find the column in the hierarchy tree.
In this example, we chose 4 bins - which means the first 25% of items belong in bin 1, next 25% of items belong in bin 2 etc.
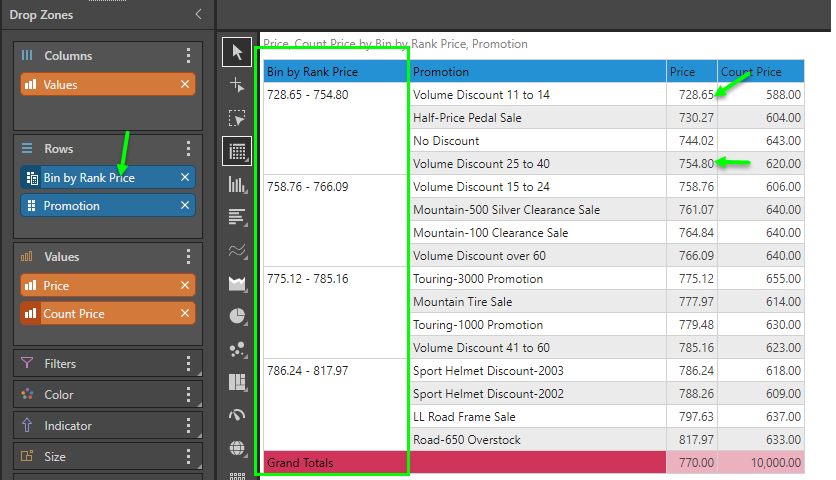
Note: The bin names are auto generated from the highest and lowest values in each bin. Also, each band has the same number of promotional items (4 items each).
Bin by Value
Bin by Value creates bins by evenly dividing the range of values found in the query numerically across the number of bands. The each data point is assigned to each band to which it belongs. The user specifies the number of bins or bands from the menu and the engine finds the lowest and highest values in the list, then produces even numeric intervals to create the corresponding to the bands. Since the values are determined to create even band definitions, it's very possible that the number of elements per band or bin will be uneven.
The new custom column that can be re-used in different parts of the query. This binning logic is only available on values or measures. It cannot be applied to hierarchies. As described, the calculation is based on the existing data points in the current query. Once determined, the bin definitions remain static regardless of any subsequent changes to the query.
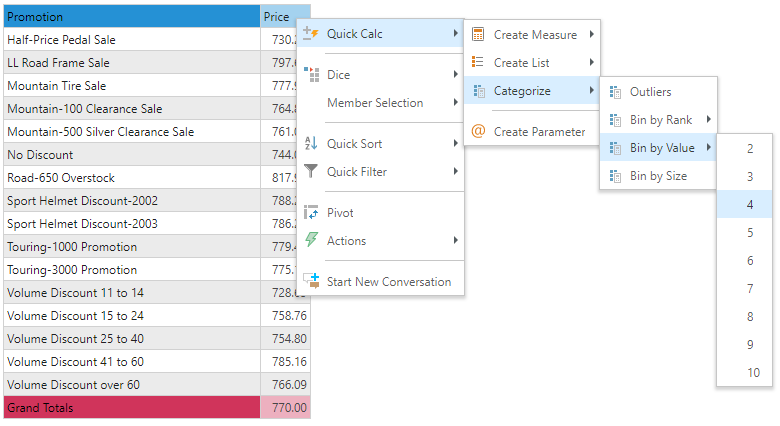
Right-click the measure in either the drop zones or the visuals and choose Quick Calc. From the submenu, choose the number of bins to create:
The new custom column will be auto-added to the query. You can also find the column in the hierarchy tree.
In this example, the lowest value is 728.65, while the highest value is 817.97. With 4 bins chosen, the bins need to be "22.33" apart (89.32 / 4). So, the first bin is 728.65 to 750.98.
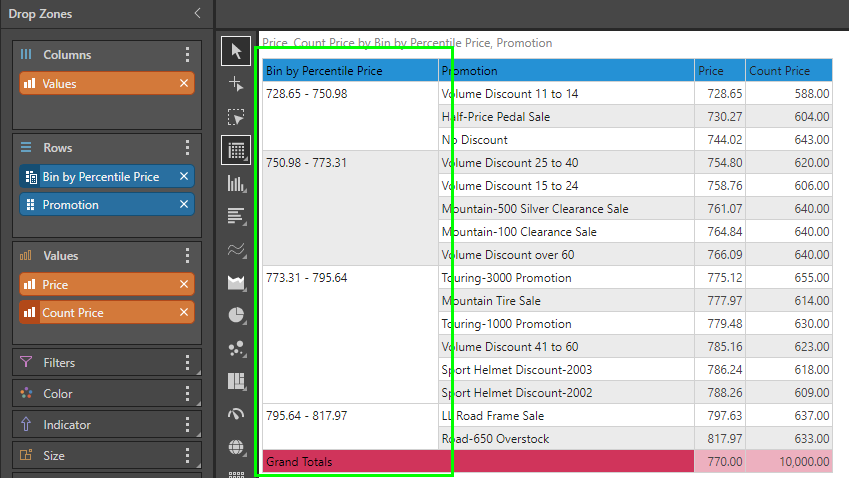
Note: Each bin may end up with a different number of items, based on how its value fits into the bin sizes set.
Static
Static categorizations are not based on query values, but rather on mechanisms for selecting elements and adding them to a category. These remain fixed regardless of subsequent changes to the hierarchies.
Geo Boundaries
Geo Boundary categorization creates a new custom column of those map elements selected on a map using the standard lasso tool with the Classify and Circle configurations selected. When you select items on the map, you demarcate those inside and outside the boundary and create a custom column representing your selections.
Bin by Category
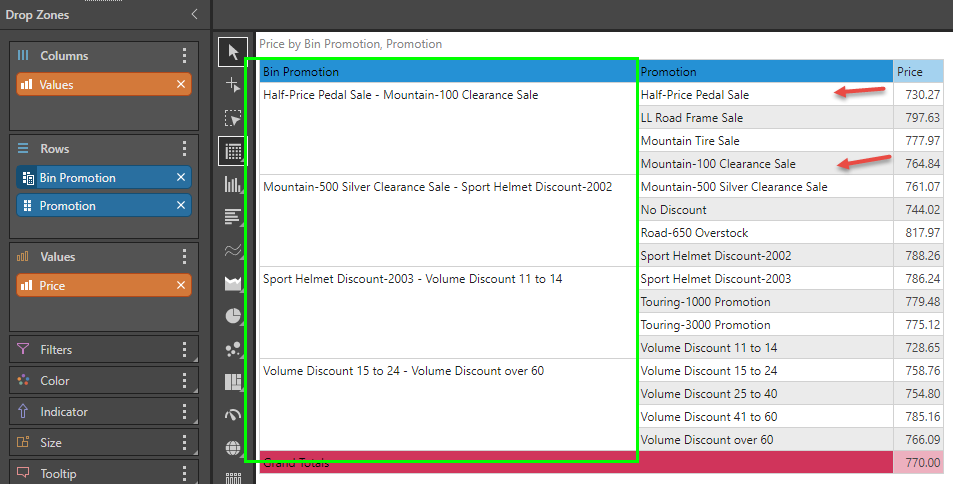
Binning by category creates a new custom column by simply banding the elements in a hierarchy using their alphanumeric captions. This is a convenient way to break down extremely long lists of hierarchical elements into a "phone book" style grouping, to make analysis simpler and easier.
The new custom column that can be re-used in different parts of the query. This binning is only available on hierarchical elements. It cannot be applied to measures. Once determined, the bin definitions remain static regardless of any subsequent changes to the query.
Right-click on the hierarchy chip in the drop zone choose "Create > Bin by Category". From the menu, choose the number of bins to create.
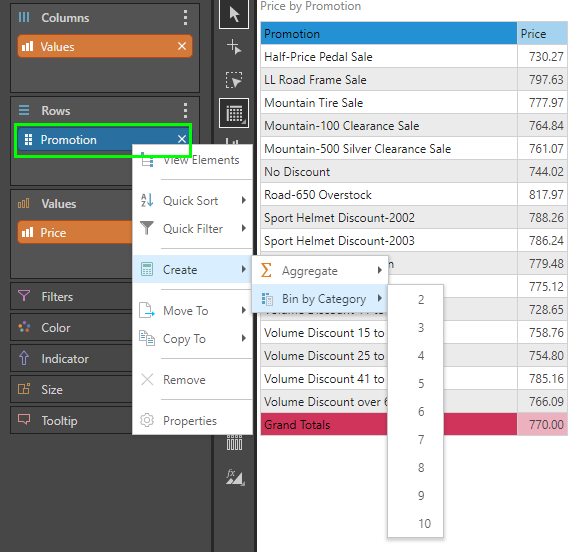
The new custom column will be auto-added to the query. You can also find the column in the hierarchy tree.
In this example, the elements were pre-sorted into alphanumeric ascending order. The start and end of each bin represents the items it contains, when evenly spread.
Granular
Bin by Size
Binning by Size creates a new custom column by banding the atomic, granular row values in the underlying table of a metric. This is a convenient way to group transactional items in size BEFORE they are aggregated as part of queries and reports. And unlike the other categorization bins, the technique is to define the size of the bin rather than the number of bins to create. This reverses the creation process, allowing the engine to determine the right number of bins to generate given the data itself.
The new custom column that can be re-used in different parts of the query. This binning is only available on measures.
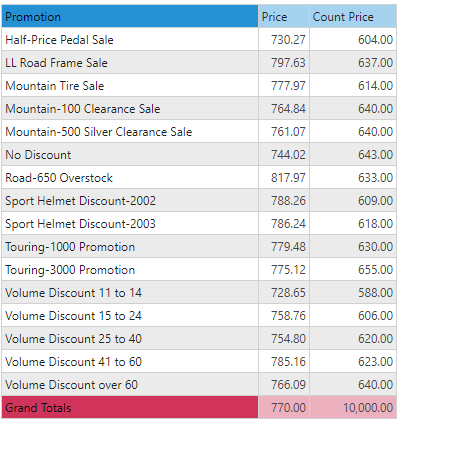
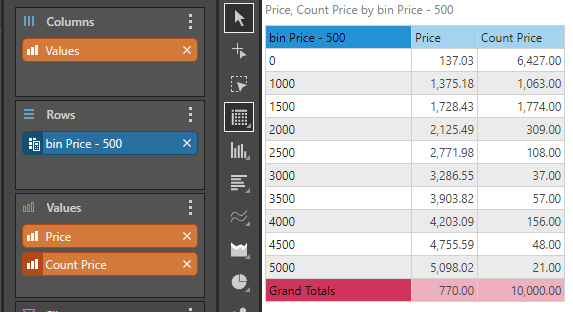
To see the effect of this Size bins, consider the following simple query - showing average price per promotion and the number of rows per promotion category.
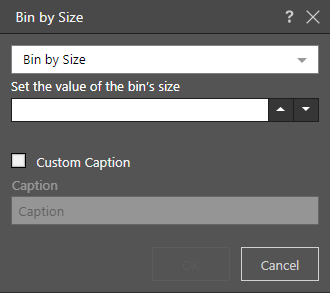
Right-click on the measure chip in the drop zone or from a visual choose "Bin by Size" to build the categorization.
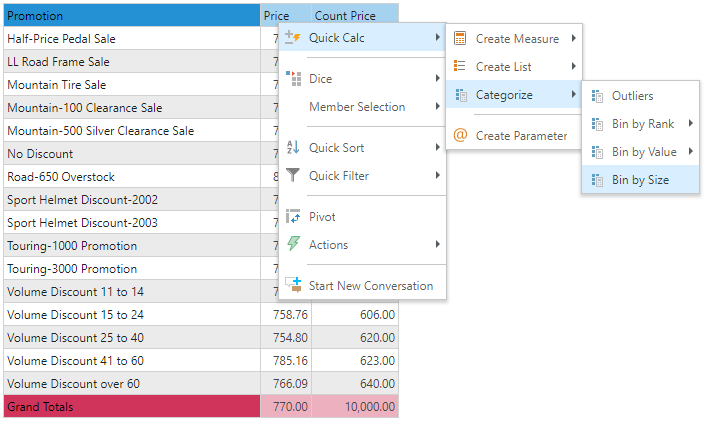
From the pop-up dialog, select the default "Bin by Size" option, then enter the value of the SIZE of the bin. The engine will create as many bins as is needed to accommodate all the granular rows in the underlying data set (or table).
The new custom column will be auto-added to the query. You can also find the column in the hierarchy tree.
In this example, the value was set to 500, therefore the engine determined that the rows in the table have prices ranging from 0 to 5000, so it built 10 bins, going up in increments of 500. Notice that the counts per bin are not even, because the individual rows match different bin sizes - yet the total count is the original 10,000.
Bin By Parameter
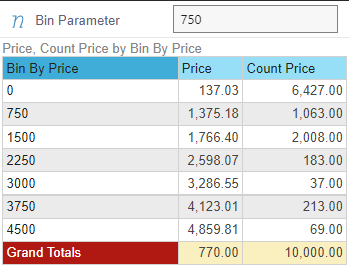
The bin size can be dynamically driven by selecting a parameter instead of entering a value for the bin size.
From the pop-up dialog, select the "Bin by Parameter" option, then select the parameter to be used to drive the bin size. The engine will create as many bins as is needed to accommodate all the granular rows in the underlying data set (or table).
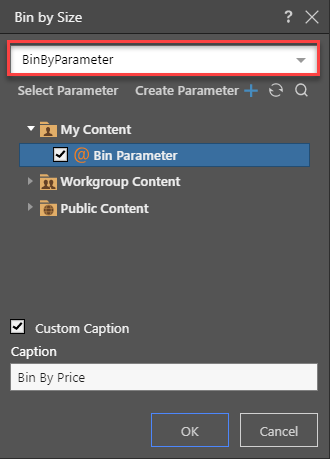
In this example, the value was set to 750, therefore the engine determined that the rows in the table have prices ranging from 0 to 5000, so it built 7 bins, going up in increments of 750. Notice that the counts per bin are not even, because the individual rows match different bin sizes - yet the total count is the original 10,000. The parameter can be changed to allow the user to dynamically determine the optimal bin size.